Grapholic is an extremely useful tool for maximizing data visualization. You can convert your raw data into meaningful Graphs in just a few clicks. The simple steps you follow are Import, plot, modify and export to get your data in graphical form.
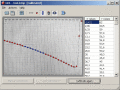
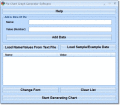
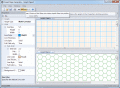
Graph Converter Lite Convert all existing paper charts and diagrams to electronic form with this easy to learn program. Just scan the graph, open the image in Graph Converter Lite, calibrate, and the modern algorithm for automatic graphs recognition
With this ActiveX (OCX) component you can display a meter, detect a silence, and display 2 types of audio graphs by the WaveIn/WaveOut buffers. Just send a pointer of the buffers array to the component the component will do the rest on the graph view
Data for business intelligence (BI) is of little use until it is converted into the information that decision makers need. OLAP Reporting Tool extends the built-in OLAP features in Excel to make them easier work with, especially for workgroups.
Archim is a program for drawing the graphs of all kinds of functions. You can define a graph explicitly and parametrically, in polar and spherical coordinates, on a plane and in space (surface). Archim will be useful for teachers and students.
Graph Paper Generator generates Cartesian (square), Multilevel Cartesian, and Hexagonal graph paper.It has a WYSIWYG configuration interface where you can customise line color, thickness, style (dash, dot, solid, etc).