Triangle Chart Patterns Software 1.0
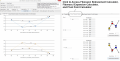
Triangle pattern is the most traded chart pattern in currency trading. There are three types of triangles most traded in currency trading.
$397.00
Download (488 Kb)