|

|
Antaeus 3.3.66
Antaeus is a utility that provides simple way to explore data plots that can be used to confirm or deny the merits of statistical analyses. In Antaeus, the scatter plots become a world of navigable data visualization.
free download (21.95 Mb)
|
|
|
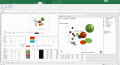
Bubble Maps Software 9.0
MM4XL software - Bubble maps, scatter plot and circle charts in Excel. Useful for marketing segmentation, association and prediction analysis
free download trial (16.32 Mb)
|
|

|
5dchart Add-In (for MS Excel) 2.1
5dchart Add-In (for Microsoft Office Excel) provides unmatched flexibility and highly customizable bubble-chart visualization for complex multi-dimensional data.
free download trial (541 Kb)
|
|
|
|
|
|
Visual Data For Academic 3.2.0
Scientific data visualization software. Creating vertex, grid and surface model, color map, contour plot, vector plot, 4D scatter, 4D slice and 4D vector.
free download trial (3.15 Mb)
:: order online ($150.00)
|
|
|
5dchart Add-In for MS Excel 3.2.0.1
5dchart Add-In (for Microsoft Office Excel) provides unmatched flexibility and highly customizable bubble-chart visualization for complex multi-dimensional data.
free download trial (6.42 Mb)
|
|

|
ArcadiaCharts 1.0.5
Free charting library: arcadiaCharts builds attractive, interactive 2D and 3D JavaScript and GWT charts within minutes. No Flash required. Line, area, pie, donut (doughnut), bar, column, scatter, xy, logarithmic scale charts, time plot.
free download (12.19 Mb)
|
|
|
|
|
|
Visual Calculus For Academic 3.9
Visual Calculus is an easy-to-use calculus grapher for Graphing limit, derivative function, integral, 3D vector, series, ode etc. Which can create 2D, 2.5D and 3D function graphs, animations and table graphs.
free download trial (3.75 Mb)
:: order online ($60.00)
|
|
|
Excel Graph Multiple Equations Software 7.0
Plot multiple functions in MS Excel. Excel 2000 or higher required.
free download trial (769 Kb)
|
|

|
Chartz 2.29
Charting tool for the rapid design of 13 different chart types, including bar, dot, horizontal bar, line, pie, donut, scatter, xy, area, histogram, error bar, bubble, gantt and volume charts. Additional features include 3D and multiple datasets
free download trial (7.63 Mb)
|
|
|
AnyChart JS Charts and Dashboards 8.7.0
AnyChart is a flexible, cross-platform/browser, dependency-free JS chart library for adding interactive bar, area, pie, column, spline, scatter, line, gauge, treemap, funnel, sparkline, Mekko, Venn, other HTML5 charts/dashboards to any website/app.
free download trial (17.81 Mb)
|
|
Pages : 1 | 2
| 3
| 4
| 5
|
|
|
|
