|

|
SmartChart XP 1.0.1
Smart-Chart is a MS-Excel based application that automatically creates Flow-Charts. The usability and advantage of these Flow-Charts have been increased immensely compared to the traditional Flow-Chart approach.
free download trial (844 Kb)
|
|
|
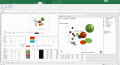
5dchart Add-In for MS Excel 3.2.0.1
5dchart Add-In (for Microsoft Office Excel) provides unmatched flexibility and highly customizable bubble-chart visualization for complex multi-dimensional data.
free download trial (6.42 Mb)
|
|

|
JGantt 2010.1
JGantt is gantt chart component for Swing. Supports: simple data model, lazy loading, internationalization, in-place editing, data binding, date granularity controlled by zoom policy and unique chart layers painting . Fully customizable. Try it free.
free download trial (1.23 Mb)
|
|
|
|
|

|
Mass Gain Routine Fitness Chart for Kids 3.0.1.1
Mass Gain Routine Fitness Chart for Kids www.ownfitnesstrainer.com has low price and demo version of download fitness chart for kids, man and women fitness chart for exercise to make perfect body in less time.
free download trial (425 Kb)
|
|

|
AnyChart Flash Gantt Component 4.1.0
Anychart Flash Gantt is a superb, customizable component for displaying Gantt charts. It is light, fast and highly effective for use in web applications. Create groups, connectors and milestones with a simple XML configuration!
free download trial (13.2 Mb)
|
|
|
TeeChart Pro ActiveX 2018
TeeChart ActiveX charting component offers hundreds of Graph styles in 2D and 3D, 56 mathematical and statistical Functions for you to choose from together with an unlimited number of axes and 14 toolbox components. For Windows and Web applications.
free download trial (32 Mb)
|
|
|
|
|

|
UIChart iOS component 1.1.0
The Rustemsoft UIChart control enables to create iOS apps with simple, intuitive, and visually compelling chart for complex statistical or financial analysis in different graph types that include Pie, Bar, Line, Cylinder, Area, and other chart types.
free download trial (3.05 Mb)
|
|
|
CYTSoft Psychrometric Chart 2.2
An interactive and intelligent psychrometric chart program for HVAC engineers. It provides the most accurate and reliable data based on Hyland and Wexler's reports published by ASHRAE, which treat air and vapor as real gases, rather than ideal gases.
free download trial (2.35 Mb)
|
|

|
NextwaveSoft WPF Suite Chart and Gauge 2.0
Nextwave Software WPF Suite with WPF Chart and Gauge is a component suite that helps you to visualize your data in Windows Presentation Foundation applications.
free download trial (13.92 Mb)
|
|
|
CharTTool 2.17
CharTTool is an advanced stock market charting software that instantly allows you to display several technical charts of stocks, mutual funds, currencies or market indices in intraday or end of day chart format. Technical analysis is also available.
free download trial (1.12 Mb)
:: order online ($39.95)
|
|
Pages : 1
| 2
| 3
| 4
| 5
|
|
|
|
