|
|
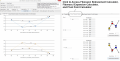
Chart Patterns Tutorial 3.5
Chart Patterns Tutorial is a software for investors and traders. This tool can help you to learn Fibonacci Price Pattern, Harmonic Pattern, and Elliott Wave. In addition, this tool provides Fibonacci Ratio Calculator and Pivot Point Calculator.
free download (891 Kb)
|
|

|
Hard Drive Pie Chart Software 7.0
Compare the size of folders with one another. Output is produced in an easy-to-read pie chart.
free download trial (754 Kb)
|
|
|
TeeChart Java for Android 2018
Charting library for Android platform, written in native Android Java and supports most teechart series types including pie chart, line chart, points, area, bar, gauges and maps and 2D, 3D formats.The Charting library includes 100% native Java code.
free download trial (25.22 Mb)
|
|
|
|
|

|
5dchart Add-In (for MS Excel) 2.1
5dchart Add-In (for Microsoft Office Excel) provides unmatched flexibility and highly customizable bubble-chart visualization for complex multi-dimensional data.
free download trial (541 Kb)
|
|

|
Gym Exercise Chart Free Download 3.0.1.1
Gym Exercise Chart Free Download initiate home workout chart that stop wasting time in your gym and provide total body strength fitness tips.
free download trial (455 Kb)
|
|

|
Free Hindi Unicode Editor 2.0.0
Hindi Unicode Editor is effective tool for editing and converting text in Devnagri script like Hindi, Marathi etc. It can edit RTF/TXT file and allows saving the edited text. It is totally free of cost. It has onscreen keyboard for typing text.
free download (1.96 Mb)
|
|
|
|
|

|
Excel Gantt Chart Template Deluxe 2.6
Excel Gantt Chart Template. Create Gantt charts in Excel. Manage daily, weekly and monthly projects in Excel. Manage up to 100 tasks and team members. Includes ability to change chart colors and options. Works with Excel for Windows and Mac.
free download trial (747 Kb)
|
|

|
Nevron Chart for SSRS 2016.1
Nevron Chart for SSRS (market's leader for its visual style, effects,layout features and data integration) is a solution,designed to provide an easy and powerful way to implement state-of-art charts in any report, modified with MS Reporting Services.
free download trial (32 Mb)
:: order online ($889.00)
|
|
|
Manco.Chart for .NET 4.4
Manco.Chart for .NET is a powerful charting component used to create attractive 3D and 2D charts for desktop applications and web pages using .NET technologies. 3D charting uses the OpenGL graphics engine to create sophisticated 3D charts and graphs.
free download trial (6.46 Mb)
:: order online ($39.00)
|
|

|
Hedge Fund Stock & Forex Chart Indicator 3.0 3.0
Hedge Fund Stock & Forex Chart Indicator:
Spot the true trend of the stock before the market opens
Time your entry levels with laser precision.
Allows you to use tight stops!
Use it on any security: Stocks, Forex, Commodities, Bonds, etc..
free download (1.31 Mb)
|
|
Pages : 1
| 2
| 3
| 4 | 5
|
|
|
|
