|
|
Lavastorm Analytics Engine, Public 4.6.0
A powerful and visual tool for data integration, transformation, and analysis. Use it to unify data locked in silos or scattered on desktops and to reduce the time to manipulate data from Excel, CSV, or ASCII files by 90% or more.
free download (32 Mb)
|
|
|
SharePoint Project Progress Monitor 1.1.111.0
SharePoint Project Progress Monitor visually enhances the status of a SharePoint project or task by displaying numerical data graphically in the form of percentage-based bars
free download trial (313 Kb)
|
|

|
FasteR 0.4.1
FasteR Desktop is a combination of GUI and IDE for R statistical language. FasteR Desktop is stand-alone independent application for R. This application allows you to use mutliple tools and features for produsing R code.
free download trial (1.77 Mb)
|
|
|
|
|
|
SharpShooter Collection 6.4
SharpShooter Collection is a package of .NET components for data processing, analysis and visualization. The suite includes a report generator, OLAP component, a tool for creating digital dashboards and KPI and a component for charts, graphs design.
free download trial (32 Mb)
|
|

|
MatBasic 1.28
The MatBasic is the language of mathematical calculations. Strong mathematical base: full complex arithmetic's, linear algebra and operations, nonlinear methods and graphical visualization.
free download trial (3.96 Mb)
|
|

|
Grapholic 1
Grapholic is an extremely useful tool for maximizing data visualization. You can convert your raw data into meaningful Graphs in just a few clicks. The simple steps you follow are Import, plot, modify and export to get your data in graphical form.
free download trial (8.12 Mb)
|
|
|
|
|
|
SimpleTruss 2.0.2.83
Draw and automatically calculate simple trusses. Good for students, playing or simply checking of an idea.
free download (1.07 Mb)
|
|
|
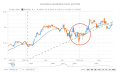
AnyStock Stock and Financial JS Charts 8.7.0
AnyStock Stock and Financial JS Charts is a flexible JavaScript charting library to visualizing large data sets in interactive HTML5 charts. Designed to display date/time information it offers various chart types, drawing tools, technical indicators.
free download trial (17.81 Mb)
|
|

|
VisProtSSS 1.2
In the Age of Molecular Biology look at the most intrigue molecules - Proteins, DNA, if you have a rest. You can use Screen Saver VisProtSSS to look at the proteins in stereo for the education purposes, as a hobby, with curiosity or simply for a fun.
free download trial (2.39 Mb)
:: order online ($15.00)
|
|
|
LightningChart Ultimate SDK 2.0.1
LightningChart Ultimate SDK is the fastest 2D and 3D measurement, engineering and research data visualization SDK for .NET and Windows. LightningChart Ultimate is entirely GPU accelerated and performance optimized.
free download trial (19.07 Mb)
|
|
Pages : 1
| 2
| 3
| 4
| 5
|
|
|
|
