Add Powerful reporting features to your Web / Intranet pages and applications. With the advanced graphing functionality you will be quickly adding impressive and dynamic charting capabilities bringing your data alive !
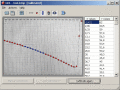
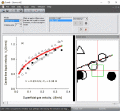
Graph Converter Lite Convert all existing paper charts and diagrams to electronic form with this easy to learn program. Just scan the graph, open the image in Graph Converter Lite, calibrate, and the modern algorithm for automatic graphs recognition
Set of components which will be estimated by any programmer, in particular RxRichEdit (with support BMP of maps). Components for operation with forms, databases, visualisation
Easy, fast and visual decision making inc entry, model, ranks, score and charts. Entry: Numbers, radio bar ranges, must-haves, %. Grids: Traffic lights, Averages, Statistics. Charts: Bar, Star Charts, Strength and Bubble (2x2). Smarts: Hi-Lo, Weigths
XYZ Data Viewer is an easy way to analyze a variety of tabular data from Microsoft Excel in the view of 3-dimensions graph. With this tool You can view and examine your data as a three-dimensional object in three-dimensional space, by manipulate it.
Obtain data from images of graphs scanned from articles or available as image; define locations of the graph's axes, pick points, scan points or scan curves, copy the scanned data to Excel or save to file.
With this ActiveX (OCX) component you can display a meter, detect a silence, and display 2 types of audio graphs by the WaveIn/WaveOut buffers. Just send a pointer of the buffers array to the component the component will do the rest on the graph view