|
|
TeeChart NET for Xamarin.Forms 2018
TeeChart Charting Controls for Xamarin.Forms offer the most common chart types, gauges and maps with customizable tools for data visualisation in mobile applications.
free download trial (18.75 Mb)
|
|

|
Nevron Chart for .NET 2016.1
Nevron Chart for .NET is a professional charting component for .NET, featuring numerous business, scientific and financial charting types, gauges, VS design time support, AJAX support, built-in toolbar, flexible axes, and much more.
free download trial (32 Mb)
:: order online ($589.00)
|
|

|
Dragonfly Chart .Net 2.000
.Net Window Form Chart Components can be widely applied in many industry HMI applications, financial and insurance applications, scientific research and analytical applications, development-simulation applications
free download trial (3.55 Mb)
|
|
|
|
|
|
Excel Save Selected Cells As JPG Software 7.0
Export a block of selected MS Excel cells to a JPG file. Excel 2000 or higher required.
free download trial (983 Kb)
|
|
|
StockChartX 5.8
StockChartX is a component that can import raw stock data, display it graphically, embed chart objects, and save/load in XML file format. Use StockChartX as your essential front-end data analysis tool for developing interactive financial apps.
free download (1024 Kb)
|
|
|
Triangle Chart Patterns Software 1.0
Triangle pattern is the most traded chart pattern in currency trading. There are three types of triangles most traded in currency trading.
free download trial (488 Kb)
|
|
|
|
|
|
Manco.Chart for Compact Framework 5.0.0.0
Manco.Chart for Compact Framework is the perfect solution to add the most advanced, feature rich charts to the applications written for .NET Compact Framework platform (Windows Mobile).
free download trial (1.19 Mb)
|
|
|
AnalyzerXL Pro 7.0.2
AnalyzerXL Pro is an add-in for Microsoft Excel 2010 designed to help you create trade systems and conduct technical analysis calculations directly in your worksheets.
free download trial (1.38 Mb)
:: order online ($74.95)
|
|
|
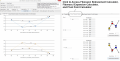
Chart Patterns Tutorial 3.5
Chart Patterns Tutorial is a software for investors and traders. This tool can help you to learn Fibonacci Price Pattern, Harmonic Pattern, and Elliott Wave. In addition, this tool provides Fibonacci Ratio Calculator and Pivot Point Calculator.
free download (891 Kb)
|
|

|
Hard Drive Pie Chart Software 7.0
Compare the size of folders with one another. Output is produced in an easy-to-read pie chart.
free download trial (754 Kb)
|
|
Pages : 1
| 2
| 3
| 4 | 5
|
|
|
|
