|
|
|
|
|
|
|
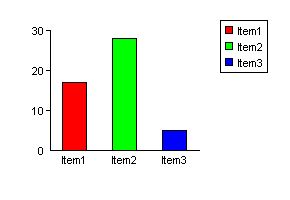
Draw bar, pie and line graphs in ASP.NET.

|
CsASPNetGraph 1.1
Author:
Supported languages: English
Supported OS: Win2000 / Win7 x32 / Win7 x64 / WinOther / WinServer / WinVista / WinVista x64 / WinXP
Price: $60.00
|
|
|
|
|
|
This ASP.NET component draws pie and bar charts and line graphs "on the fly". Output can be streamed to the browser in GIF or other formats, saved to file or exported to a Bitmap structure. A wide range of properties allow the customisation of colour, size and text style. Built in defaults allow the production of graphs with only a few lines of code. Show percentages or actual values. Generate the colours at random if prefered. Bar charts have a choice of orientation - vertical or horizontal, and a stacked bar chart option is availble. Trend lines can be shown on bar charts as well as additional plotted lines. Bar charts and line graphs can auto calibrate the axes. All the graphs can show legends. Additional text and lines can be added to annotate the graph. Text supports Unicode characters. HTML image maps can be produced. The component can also be used with Windows Forms applications. Free trial available with full instructions.
|

Free CsASPNetGraph download - 595 Kbcsngt.zip
|
| Keywords:
asp, component, dll, aspnet, dotnet, net, graph, chart, pie, bar, gif, display, data, line, plot, png |
|
|
|
|
|