
|
|
|
|
|
|
|
AnyMap: interactive JavaScript HTML5 maps.
|
AnyMap JS Maps 8.7.0
Author:
Supported languages: English, Arabic, Chinese, German, Japanese, Portuguese, Russian, Spanish
Supported OS: WinXP / Win7 x32 / Win7 x64 / Windows 8 / Windows 10 / WinServer / WinOther / WinVista / WinVista x64 / Linux / Linux Console / Linux Gnome / Linux GPL / Linux Open Source / Mac OS X / Android / iPhone / iPad / iOS
Price: $49.00
|
|
|
|
|
|
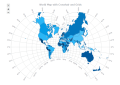
AnyMap JS Maps is an advanced JavaScript/HTML5 mapping library which makes you able to easily create interactive maps that look great on any device including PCs, Macs, iPhones, iPads, Android devices and others - on any platform and in any browser.
AnyMap JS is perfect for interactive dashboards and side-by-side reporting. You can use it to display sales by region, election results, weather forecast, population density, and any other geo-related data.
AnyMap JS comes with our ready-to-use Map Collection which you can use at no additional cost. Maps are supplied in GeoJSON, which makes them flexible in working and editing. Custom maps can be created from any SHP map.
AnyMap JS maps are fully compatible with other AnyChart JS Charts' HTML5 charting solutions - AnyChart JS (basic JavaScript charts), AnyStock JS (date/time JavaScript/HTML5 charts, e.g. financial and stock charts that visualize real-time data), and AnyGantt JS (JavaScript/HTML5 Gantt charts), and can be used both in a dashboard and as a standalone map visualization solution.
Features of AnyMap JS:
* Ever-expanding Map Collection with various country-specific and world maps.
* Highly customizable. Special reaction to certain events can be assigned with the help of event listeners.
* Wide variety of interactive options for your HTML5 maps, including tooltips, selection, hover, drill-down, etc.
* Support for various types of maps including Choropleth Map, Point (Dot) Map, Bubble Map, Connector Map, and Seat Map for displaying data related to geographic areas in HTML5 based web projects.
* Longitude/latitude support allows you to set coordinates (location) of Bubbles in Bubble JavaScript Charts in long/lat degrees. The API allows you to convert mouse coordinates to longitude and latitude (transform), and vice versa.
* Changing scale, moving map, and creating custom UI (buttons, scrolls, etc.) via API.
* Rich integration of keyboard and mouse controls.
* Map projections.
|

Free AnyMap JS Maps download - 17.81 Mbanychart-installation-package-8.7.0.zip
|
| Keywords:
javascript maps, html5 maps, anychart, anymap, interactive map, js charts, interactive js maps, map collection, data visualization, javascript charting library, javascript mapping library, map visualization, charts, ajax charts, maps, javascript API |
|
|
|
|
|
